exosim.tasks.parse.parseSource#
Classes#
Given the source descrition, it parses the sources elements and return a dictionary. |
|
Given the source parameters, it parses the source element and returns a dictionary. |
Module Contents#
- class ParseSources[source]#
Bases:
exosim.tasks.task.TaskGiven the source descrition, it parses the sources elements and return a dictionary. It also applyes the time variation if provided.
Examples
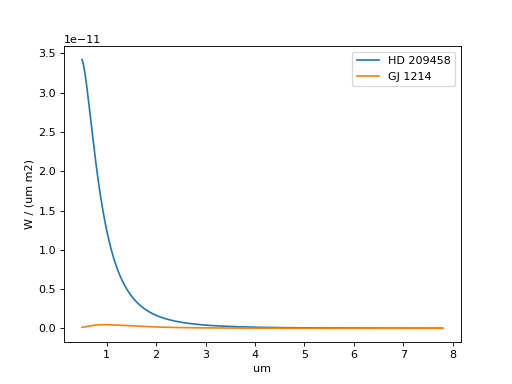
>>> import astropy.units as u
>>> import numpy as np
>>> from exosim.tasks.parse import ParseSources
>>> from collections import OrderedDict
>>>
>>> wl = np.linspace(0.5, 7.8, 10000) * u.um
>>> tt = np.linspace(0.5, 1, 10) * u.hr
>>>
>>> sources_in = OrderedDict({'HD 209458': {'value': 'HD 209458',
>>>                                         'source_type': 'planck',
>>>                                         'R': 1.18 * u.R_sun,
>>>                                         'D': 47 * u.pc,
>>>                                         'T': 6086 * u.K,
>>>                                         },
>>>                           'GJ 1214': {'value': 'GJ 1214',
>>>                                       'source_type': 'planck',
>>>                                       'R': 0.218 * u.R_sun,
>>>                                       'D': 13 * u.pc,
>>>                                       'T': 3026 * u.K,
>>>                                       }, })
>>>
>>> parseSources = ParseSources()
>>> sources_out = parseSources(parameters=sources_in,
>>>                            wavelength=wl,
>>>                            time=tt)
>>> import matplotlib.pyplot as plt
>>>
>>> plt.plot(source_out['HD 209458'].spectral, source_out['HD 209458'].data[0,0])
>>> plt.ylabel(source_out['HD 209458'].data_units)
>>> plt.xlabel(source_out['HD 209458'].spectral_units)
>>> plt.show()
- class ParseSource[source]#
Bases:
exosim.tasks.task.TaskGiven the source parameters, it parses the source element and returns a dictionary. It also applyes the time variation if provided.
Examples
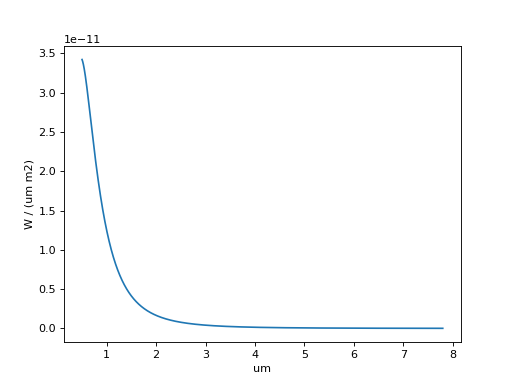
>>> from exosim.tasks.parse import ParseSource
>>> import astropy.units as u
>>> import numpy as np
>>> parseSource = ParseSource()
>>> wl = np.linspace(0.5, 7.8, 10000) * u.um
>>> tt = np.linspace(0.5, 1, 10) * u.hr
>>> source_in = {
>>>     'value': 'HD 209458',
>>>     'source_type': 'planck',
>>>     'R': 1.18 * u.R_sun,
>>>     'D': 47 * u.pc,
>>>     'T': 6086 * u.K,
>>>     }
>>> source_out = parseSource(parameters=source_in,
>>>                          wavelength=wl,
>>>                          time=tt)
>>> import matplotlib.pyplot as plt
>>> plt.plot(source_out['HD 209458'].spectral, source_out['HD 209458'].data[0,0])
>>> plt.ylabel(source_out['HD 209458'].data_units)
>>> plt.xlabel(source_out['HD 209458'].spectral_units)
>>> plt.show()